
TL;DR:
- Friction in CAD software interfaces costs users an average of 7.1 hours per week, severely impacting productivity. Improving UX reduces these losses, prevents experience breakdowns, and optimizes industrial processes while generating significant ROI. Adopting user-centered design, anticipating edge cases, and measuring friction in the field are essential for successful digital transformation in CAD.
Friction in a CAD software interface is not a minor inconvenience. According to a benchmark on CAD friction, a user loses an average of 7.1 hours per week due to poor user experience. For a team of five engineers, this represents more than a full day of work evaporated each week, without producing a single additional part or assembly. For innovation managers and product developers in SMEs or industrial startups, understanding and correcting this friction has become a strategic issue. This guide explains why and how to take action.
Table of contents
- Why User Experience in CAD Goes Beyond Simple Comfort
- Productivity Losses Related to UX Friction in CAD
- Reducing User Effort: Avoiding Usability Cliffs and Complexity Traps
- Designing Robust CAD UX: User-Centered Cycles and Real-World Case Handling
- ROI and UX Implementation Cost: Quantifying to Convince
- UX and B2B Configurators: Supporting Decision-Making, Reducing Cognitive Effort
- What the Industry Forgets: CAD UX Is a Chain, Not a Facade
- Take Action: Resources and Solutions to Optimize CAD UX
- Frequently Asked Questions About CAD User Experience
Key Points
| Point | Details |
|---|---|
| UX Influences Productivity | Optimizing CAD user experience reduces time losses, errors, and operational costs. |
| Correcting Early Costs Less | Investing in UX from the design phase prevents costly post-development adaptations. |
| User-Centered Cycle Is Essential | ISO 9241-210 methodology provides a recognized foundation for structuring a robust UX approach. |
| Atypical Scenarios Are Critical | Handling edge cases in CAD UX increases reliability and user confidence. |
| UX Supports B2B Decision-Making | A well-designed interface facilitates sales and decision-making for industrial buyers. |
Why User Experience in CAD Goes Beyond Simple Comfort
UX has long been considered a “bonus” reserved for consumer applications. In industry, it was assumed that engineers would adapt to tools, regardless of their complexity level. This logic is now outdated. The evolution and benefits of CAD show that design software is at the heart of entire processes, not simply drawing tools.
In B2B, poor UX is not just a matter of “comfort”: it can block critical operations and increase internal costs through support calls, design errors, delivery delays, and even customer losses.
Specifically, deficient UX in CAD software translates to:
- Repeated errors during modeling or drafting, due to a confusing interface or unintuitive shortcuts
- Extended validation delays, as teams multiply back-and-forth to find the right functions or understand an error message
- Excessive reliance on technical support, which mobilizes internal and external resources for basic usage problems
- Progressive user disengagement as they bypass advanced functions, reducing the software’s return on investment
A good way to test this reality: ask your engineers how many times per week they search for a function they use regularly. Properly organizing CAD files or optimizing tolerance analysis becomes impossible if the interface itself creates obstacles at every step. CAD UX must therefore be treated as a full-fledged operational layer.
Productivity Losses Related to UX Friction in CAD
Let’s move from concept to numbers: how much does UX friction really cost in practice?
The benchmark on CAD UX cost cited in the introduction is not an isolated case. It reveals a systemic reality: interface friction generates a snowball effect. A task interrupted by a bug or poorly designed menu forces the user to regain concentration from scratch, which multiplies the actual time spent on the task.
| Friction Source | Estimated Impact | Direct Consequence |
|---|---|---|
| Complex and redundant menus | 1.5 to 2h/week | Workflow slowdown |
| Unclear error messages | 0.8 to 1.2h/week | Support requests, correction errors |
| Insufficient customization | 1 to 1.5h/week | Unoptimized repetitive sequences |
| Unintuitive file management | 1.2 to 2h/week | Incorrect versions used |
| Poorly adapted initial training | 1.6h/week (first 6 months) | Slow adoption, practice gaps |
7.1 hours per week lost on average per user: over a year, for a team of four people, this is the equivalent of more than 1,400 design hours evaporated. These hours are not accounted for in typical project budgets, which explains why the problem remains invisible for so long.
Key figure: For an industrial SME with a CAD team of 5 people paid an average of €45/h, UX friction represents an annual cost of nearly €160,000 in lost time.
The CAD innovations to adopt in 2026 can reduce some of this friction through automation and more contextual interfaces. But you still need to know where your pain points are.
Pro tip: Set up a UX incident log in your team for two weeks. Ask each user to note moments when they find themselves blocked, lost, or forced to restart an action. This inventory will give you a real map of friction, far more accurate than any theoretical audit. Good version management in CAD often starts with this type of field audit.
Reducing User Effort: Avoiding Usability Cliffs and Complexity Traps
After seeing the overall impact, let’s detail how to minimize user perception of complexity.
The notion of “user effort” goes beyond simple ease of use. CAD software can be functionally powerful while exhausting its users. When complexity increases abruptly, without progression, the user experiences what UX researchers call an experience breakdown or “usability cliff”: a tipping point where perceived effort exceeds expected value.
These breakdowns cause frustration, task abandonment, and ultimately reluctance to use the software’s advanced functions. The concrete result? Teams that master 30% of SOLIDWORKS or CATIA capabilities because the remaining 70% seems “too complicated to approach.”
To map and reduce these breaking points, here is a four-step method:
- Identify critical paths: list the five most frequent tasks of your users (e.g., create an assembly, generate a drawing, export a file)
- Measure actual effort: time each path with a representative user, counting clicks, hesitations, and errors made
- Identify breaking points: note precisely where the user pauses, makes an error, or asks for help. These are your “usability cliffs”
- Prioritize corrections: rank breaking points according to their frequency and impact on overall project timeline
Pro tip: An efficient modeling workflow is often built in reverse: start from errors observed in production to trace back to interface causes. The CAD productivity tips we regularly share come directly from this field-based logic.
Designing Robust CAD UX: User-Centered Cycles and Real-World Case Handling
Understanding user effort leads to methodology: how to structure a truly adapted experience?

The ISO 9241-210 standard describes a user-centered, iterative process structured around four phases: analysis of usage context, definition of user requirements, prototype production, and continuous testing with real users. This approach applies directly to the configuration and adaptation of CAD environments in your teams.
| “Happy path” approach | User-centered approach |
|---|---|
| Designed for ideal case | Integrates errors and retries |
| Tested under normal conditions | Tested with real users |
| Corrected after deployment | Adjusted during prototype phase |
| High correction costs | Low correction costs |
Edge cases must be treated as central paths: atypical scenarios such as returning to an ongoing task, batch correction, or recovery after error are precisely “where things break” under real usage conditions.
Specifically, in an industrial CAD context, frequent edge cases include:
- A user resuming a partially modeled assembly after an interruption of several days
- An engineer who must integrate a last-minute modification to a part already drafted
- A file export to a partner using an earlier version of the software
These situations are not rare exceptions. In the reality of industrial SMEs and startups, they represent a significant portion of daily work. Good CAD project documentation must anticipate these scenarios and provide clear procedures.
ROI and UX Implementation Cost: Quantifying to Convince
Methodological structuring must be accompanied by numbers to bring decision-makers on board.
The UX argument is often perceived as “soft” by finance departments. Yet the data is clear. Correcting a UX error after deployment can cost up to 100 times more than if the correction had been made during the initial design phase. This ratio, documented notably by IBM, applies equally to internal software and internally configured industrial tool interfaces.
| Correction Phase | Relative Cost | Implementation Timeline |
|---|---|---|
| During design phase | 1x | A few hours |
| During prototyping phase | 5x to 10x | A few days |
| After deployment | 50x to 100x | Several weeks to months |
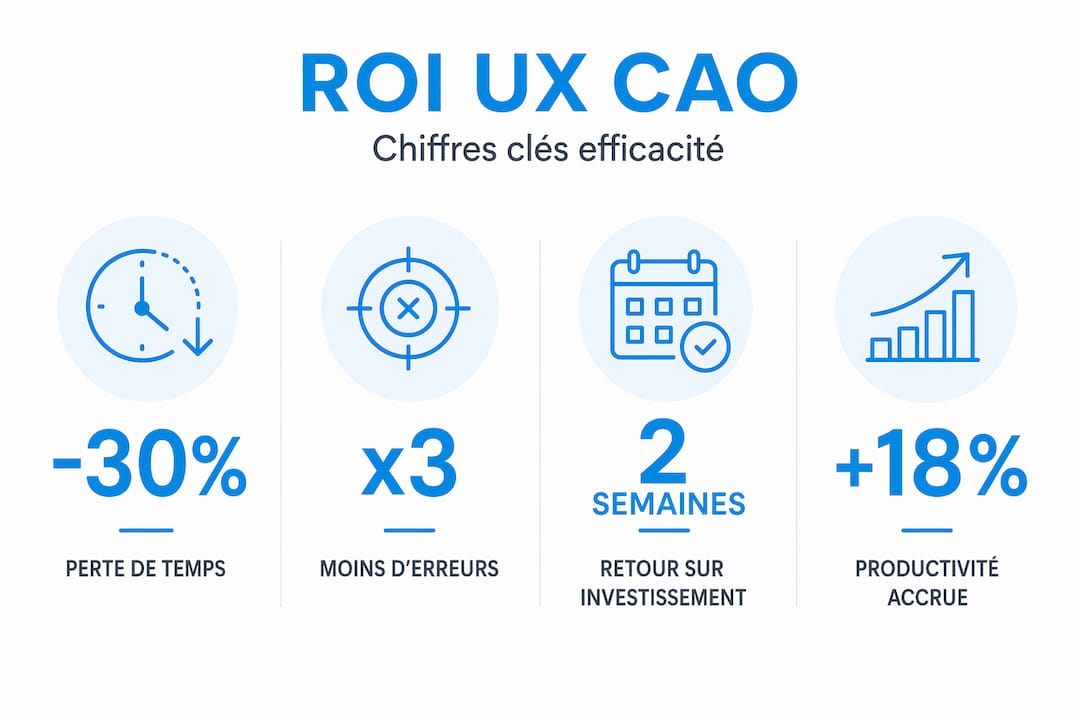
A Forrester Consulting study conducted for UserTesting reports an ROI of 415% over three years for companies that invested in structured user testing processes, with return on investment achieved in less than six months.
To convince your decision-makers, build your case around three key metrics:
- Time lost per user: calculate friction in hours, convert to salary cost
- Design error rate: how many non-conformities are related to poor interface understanding?
- Internal support cost: how many hours does your team spend answering basic usage questions?
The measurement of UX return on investment must be presented not as a “design” budget but as a productivity investment directly comparable to task automation. Moreover, automating certain CAD tasks and improving UX are two complementary levers that mutually reinforce each other.
UX and B2B Configurators: Supporting Decision-Making, Reducing Cognitive Effort
Finally, let’s move beyond fundamentals and figures to address a typical application case: B2B sales support.
In an industrial B2B context, UX does not only concern internal design teams. It also directly affects the experience of buyers and decision-makers who interact with your configurators and product visualization tools. According to an analysis of complex B2B product configurators, a well-designed interface significantly reduces buyer cognitive effort and accelerates decision-making.
Concrete benefits of optimized UX for B2B sales include:
- Immediate visualization: the buyer sees in real time the impact of each configuration option, without needing a technician to interpret the results
- Reduction of order errors: an interface that validates option combinations in real time eliminates impossible or inconsistent configurations
- Shortened sales cycle: when the buyer immediately understands what they are purchasing, validation and negotiation cycles are considerably reduced
- Measurable competitive advantage: companies offering 3D or augmented reality configuration experience stand out clearly in their markets
Industrial 3D configurators now represent a commercial growth lever for SMEs that know how to deploy them correctly. Resources such as online showroom advice illustrate how similar sectors apply these principles to transform their customer relationships.
What the Industry Forgets: CAD UX Is a Chain, Not a Facade
Here is an angle that challenges habits and, in our experience, makes the difference between teams that progress and teams that stagnate.
Most UX improvement projects in industrial environments stop at the interface: redesigning a menu, adding a shortcut, simplifying a dialog box. This is useful. But insufficient. As experts in B2B industrial design emphasize, industrial UX must be treated as an end-to-end chain: before use (training, onboarding), during (the interface itself), and after (support, correction, evolution).
When only the “happy path” is addressed (the ideal case where everything goes well), an illusion of quality is created that collapses as soon as the user encounters an unforeseen situation. Yet, under real industrial production conditions, unforeseen situations are the norm, not the exception.
Our conviction: teams that measure friction at all levels of the chain (not just at the main interface) achieve lasting results. This involves integrating field feedback into tool configuration cycles, treating edge cases as priorities rather than details, and considering each usage incident as an improvement signal.
UX challenges in CAD are not limited to “making the software prettier.” It is about ensuring that every user, at every stage of their work, finds in the tool a reliable ally rather than an obstacle to overcome. It is this systemic vision that separates successful CAD deployments from laborious adoptions.
Take Action: Resources and Solutions to Optimize CAD UX
After this perspective, it is time to move from theory to your next concrete steps.
At OhMyCAD, we support industrial startups and SMEs every day in optimally adopting their design tools. Whether you are in the solution selection phase or seeking to improve adoption of already deployed software, we have the resources to help you move forward.
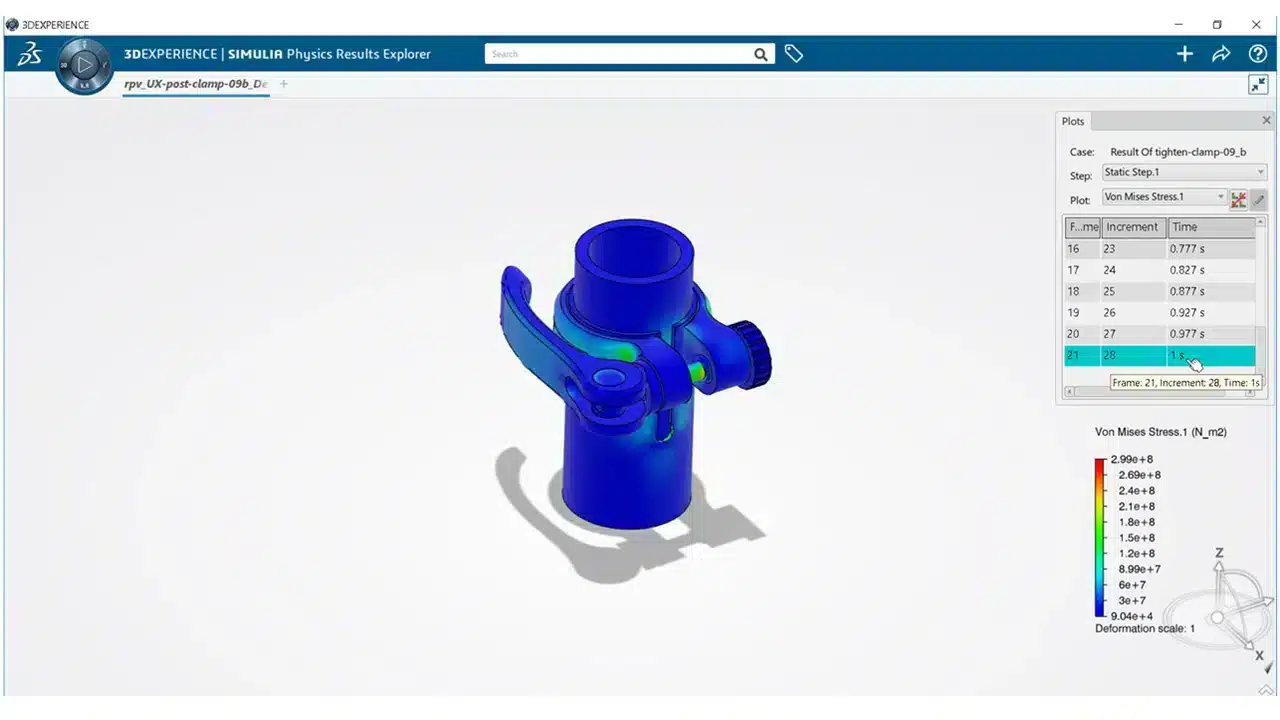
Discover how the 3DEXPERIENCE platform natively integrates features designed to reduce UX friction and streamline collaboration between teams. Explore our selection of CAD tools for SMEs and startups to find the solution suited to your context. And if you wish to deepen your understanding of 3D visualization in CAD, our specialized guides will give you the foundations to choose the right formats and tools for your projects. Our team is available to support you, step by step.
Frequently Asked Questions About CAD User Experience
What indicators measure the impact of UX in CAD?
Time lost per user, error rate, support requests, and validation time are key metrics. A CAD benchmark quantifies this loss at 7.1 hours per week on average, providing a directly usable calculation basis for your team.
Why does correcting UX upstream cost less?
Correction after development can cost up to 100 times more than during design, as it involves modifying existing code, retraining users, and sometimes reworking data already produced with the old interface.
What method for designing reference CAD UX?
ISO 9241-210 standard recommends a user-centered cycle: context analysis, requirements definition, prototyping, and iterative testing with real users involved at each stage.
How does CAD UX support B2B sales?
Well-designed UX in a B2B configurator optimizes context visualization, clarifies valid options, and reduces buyer cognitive effort, which directly shortens the sales cycle.
Should edge cases be addressed in CAD UX design?
Yes, absolutely. Atypical scenarios such as corrections, retries, or handling errors are frequent real-world uses and must be integrated from the design phase to ensure robust production experience.